
Free initial assessment

Your data, finally pointing in one direction.

We turn spreadsheets, systems and databases into clear, automated dashboards ready for real decisions — in Power BI or on the web.

Dashboards for finance

Rather talk first? Book a 30-minute call

  • Power BI + Webthe right technology for each context
  • Connected dataExcel, ERPs, APIs, SQL and MySQL
  • Ongoing supportdeployment, refresh and evolution
Portfolio Financial Dashboard · 12 pages · fictitious dataOpen live ↗
26dashboards in the portfolio, in Power BI and on the web
254analysis pages to explore, with fictitious data
7–10business days to deliver an Essential Dashboard
100%documented: calculation rules, sources and routines in writing
  • Power BI
  • DAX
  • Power Query
  • SQL Server
  • MySQL
  • Excel
  • APIs REST
  • SharePoint
  • HTML · JS
  • Deneb
  • VBA
  • Automation
Why OmniData

Less manual consolidation.
More time to analyze.

If any of these scenarios sounds familiar, a good dashboard will probably pay for itself quickly.

Reports built by hand, every week, across several spreadsheets.
Automatic refresh straight from the original sources.
Each department shows a different number for the same metric.
A single version of the truth, with documented calculation rules.
Slow, confusing Power BI that nobody knows how to maintain anymore.
Restructured model, optimized DAX and clear navigation.
Problems discovered only at month-end close.
Alerts and executive readouts that anticipate deviations.
Services

From the data source
to the decision.

Tailor-made projects, with a clear scope and an architecture suited to each company’s stage.

01

Enterprise Power BI

Modeling, Power Query, DAX, governance, publishing and evolution of corporate reports.

  • Star schema and documented measures
  • Row-level security (RLS)
  • Scheduled refresh
02

Web dashboards

Responsive, standalone dashboards connected to APIs, SQL, MySQL and your own portals.

  • No per-user license
  • Your brand identity
  • Works on mobile
03

Automation and integration

Integrations and routines that eliminate manual consolidation and reduce operational risk.

  • Extraction from systems and APIs
  • Cleansing and standardization
  • Scheduled routines
04

Ongoing analytics

Maintenance, refresh, support and periodic review of your most important metrics.

  • Fixes and small improvements
  • Data load monitoring
  • Hosting for web solutions
Portfolio

Complete dashboards, ready for decisions.
100% fictitious data.

Six highlights from a portfolio with 26 dashboards and 254 pages, in Power BI and on the web. Open, filter and explore: names, values and records were replaced with fictitious data. Dashboards are in Portuguese.
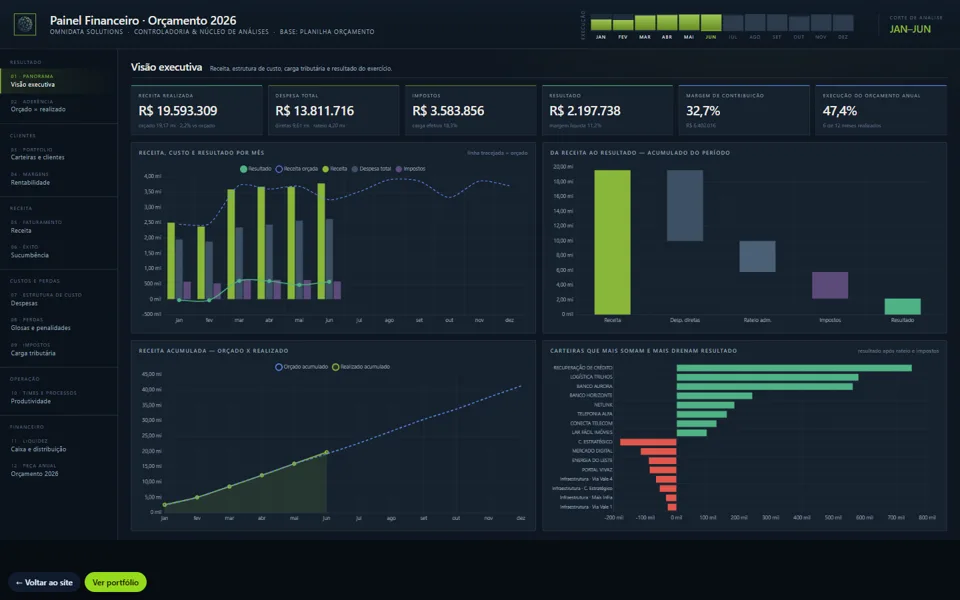
Preview of the Financial Dashboard dashboardOpen dashboard
Finance and controllingWeb

Financial Dashboard

Budget vs. actuals by portfolio, cost structure, tax burden, cash and the annual budget.
  • Revenue vs. budget
  • Margin
  • Taxes
  • Cash
  • 12 pages
Open dashboard
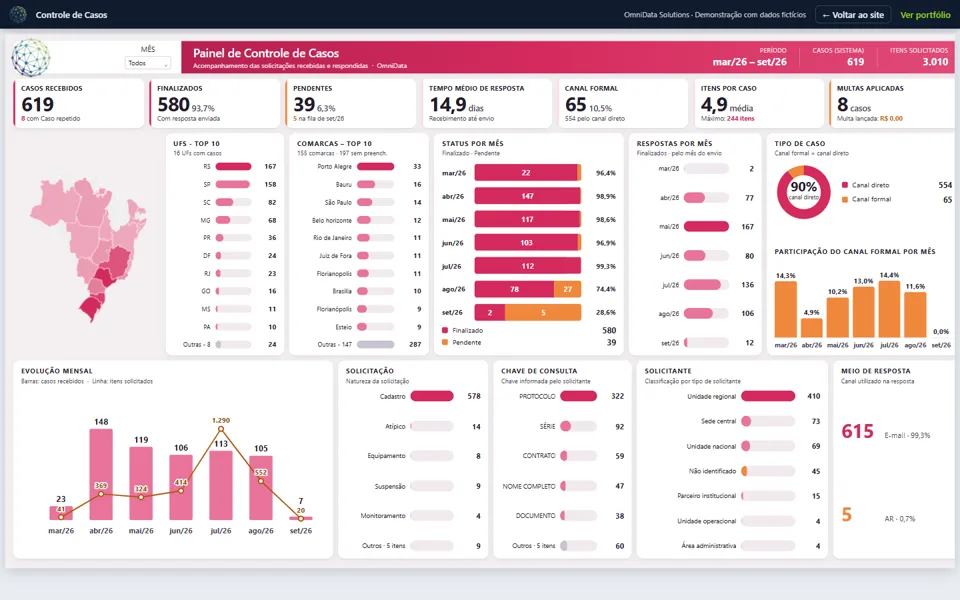
Preview of the Case Control dashboardOpen dashboard
Legal and legal analyticsPower BI

Case Control

Cases received, completed and pending, response time, map by state and requester types.
  • Response time
  • Pending
  • Map
  • Requesters
  • 1 page
Open dashboard
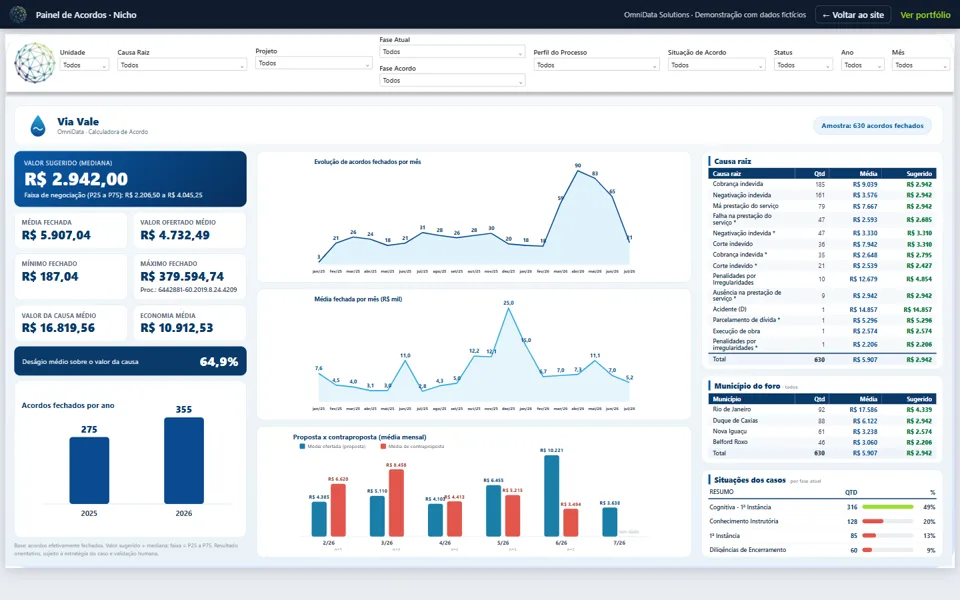
Preview of the Settlements Dashboard · Niche dashboardOpen dashboard
Settlements and negotiationPower BI

Settlements Dashboard · Niche

Suggested settlement value by median, negotiation range, average by root cause and by city.
  • Suggested value
  • P25–P75 range
  • Root cause
  • Discount
  • 1 page
Open dashboard
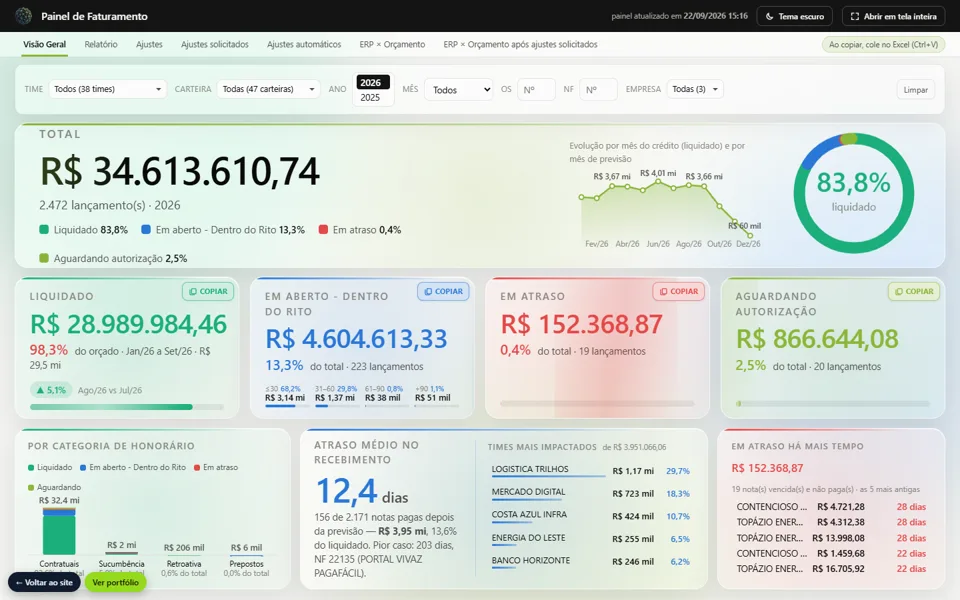
Preview of the Billing Dashboard dashboardOpen dashboard
Finance and controllingWeb

Billing Dashboard

Invoices issued, paid, open and overdue by team and portfolio, checked against the budget.

  • Paid
  • Overdue
  • Aging
  • ERP vs. budget
  • 8 pages
Open dashboard
Preview of the Settlements Dashboard dashboardOpen dashboard
Settlements and negotiationPower BI

Settlements Dashboard

Offers, counteroffers, closed settlements, savings and discount by root cause and case stage.
  • Settlements
  • Discount
  • Savings
  • Root cause
  • 7 pages
Open dashboard
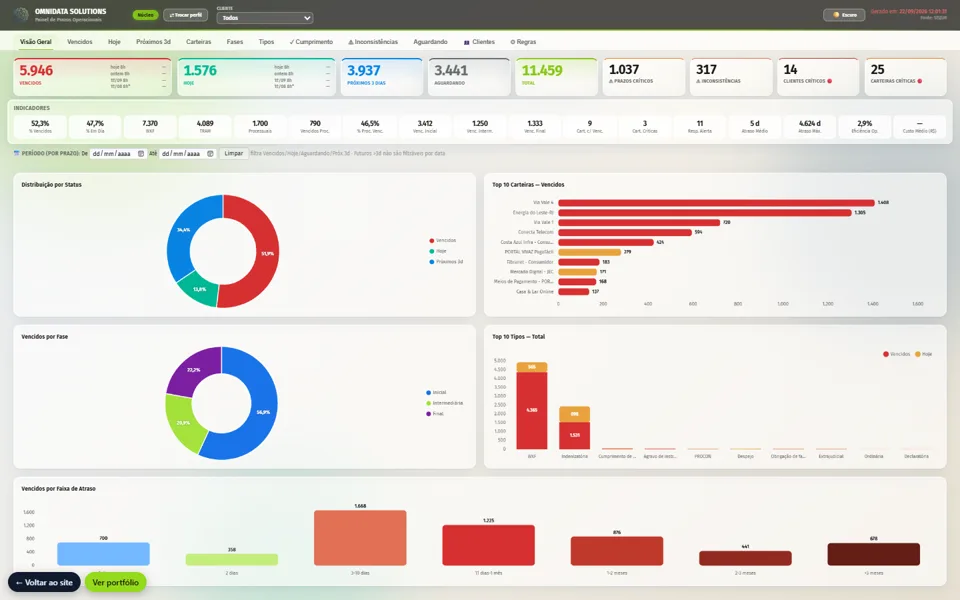
Preview of the Deadlines Dashboard dashboardOpen dashboard
Legal and legal analyticsWeb

Deadlines Dashboard

Overdue, due-today and upcoming deadlines by profile, with inconsistencies and compliance.

  • Overdue
  • Today
  • Compliance
  • Inconsistencies
  • 10 pages
Open dashboard

Experience with financial, operational, legal, billing, targets, settlements, infrastructure, people and legal analytics.

Case studies

Real projects.
Clients kept private.

Portfolio dashboards are versions of delivered projects, rebuilt with fictitious data. For confidentiality, clients are never named without their consent.

Legal · high-volume litigation

Deadlines, settlements and legal analytics for a portfolio of thousands of lawsuits

Challenge
Deadlines, settlements and outcomes for banking, telecom and retail portfolios tracked in separate spreadsheets per team.
What we built
Deadline dashboard by role (partners, core team and leads), case control, settlement range based on the historical median and analytics on recurring opposing counsel.
In practice
Overdue and same-day deadlines visible per owner, every day; settlement offers backed by the portfolio's own history.
Finance · controllership

Budget vs. actuals and margin per portfolio, after overhead and taxes

Challenge
Month-end close assembled by hand from the budget spreadsheet and the ERP, with no view of which portfolios were profitable after overhead allocation.
What we built
A 12-page Financial Dashboard (budget adherence, margins, taxes, cash and annual budget) plus a Billing Dashboard reconciling ERP and budget.
In practice
Loss-making portfolios show up already net of overhead and taxes; ERP vs. budget differences listed for review.
Operations · targets and people

Team targets, productivity and workflow in a single view

Challenge
Targets, productivity and workflow tracked in a different report for each manager, with numbers that did not match.
What we built
Management reports for targets and results, workflow movements and a people dashboard, with documented calculation rules.
In practice
Targets vs. actuals per team and the workflow history on the same data, with one rule for every area.
Portfolios and industries analyzedBanking and creditTelecomEnergyRetail and marketplacesPaymentsInfrastructureLaw firmsControllership

We can sign a non-disclosure agreement before seeing any data. See how we protect information →

About us

Data that becomes decisions. From database to dashboard.

OmniData Solutions turns scattered data (spreadsheets, systems and databases) into clear, reliable, automatically refreshed dashboards, in Power BI and on the web.

We build dashboards for controlling, billing, legal, settlements, targets, deadlines and people management: from data modeling and documented business rules to visuals designed for decision-makers. Our project management background taught us to look at what lies behind every metric and to deliver dashboards that teams actually use every day.

  • Power BI · DAX · Power Query
  • SQL and data modeling
  • Web dashboards (HTML · JS)
  • Automation with Python
  • Deneb · Vega-Lite
  • Systems and API integration
  • Legal analytics
  • Data quality and auditing
Direct service from the person who builds itIndependent professional · leads every projectWho builds your dashboards →

Finance and controlling

Budget vs. actuals, margins, billing, taxes, cash and ERP reconciliation, month by month and by portfolio.

Legal and legal analytics

Portfolios, deadlines, outcomes, settlements and legal analytics by court district, root cause and case stage.

Operations and targets

Productivity, SLAs, workflow, team targets, people and daily portfolio tracking.

Data engineering

Modeling, source integration, load automation and data quality auditing.

ClarityA good metric is one anyone understands in seconds.
RigorEvery number has a source, a calculation rule and an owner.
PartnershipWe keep up with the business after delivery.
Packages

Clear scope,
from day one to evolution.

Every project starts with a free assessment call. We always separate development, infrastructure, licenses and maintenance — no surprises.

Starting point

BI Assessment

To understand what is possible before investing.

to startFreeinitial 30–45 min call
  • Review of data sources and data quality
  • Review of current metrics and reports
  • Prioritized improvement map
  • Fixed scope and proposal
  • Full technical report: R$ 590, credited toward the project
Request an assessment
Fastest

Essential Dashboard

A focused dashboard for your most important decision.

fromR$ 1.900fixed-price project
  • Up to 3 pages
  • One structured data source
  • KPIs, filters and brand identity
  • Short training and documentation
  • Target delivery in 7–10 business days after data approval
I want the Essential
Recurring

Ongoing Plan

Your dashboard always up to date and evolving.

fromR$ 390/monthmonthly maintenance
  • Refresh and monitoring
  • Fixes and small improvements
  • Monthly support
  • Hosting for web solutions
  • Plans with 2, 5 or 10 hours of adjustments per month
Talk about support

Services provided as an independent professional, with a written agreement and a receipt (RPA for companies). Reference prices in Brazilian reais (R$). The final price depends on the sources, data volume and scope, and is always set in writing after the assessment. Software licenses (such as Power BI Pro) are not included.

OmniData method

Clarity at
every step.

The project only moves forward when metrics, data and responsibilities are aligned.

  1. 01

    Assessment

    Goals, sources, users and the decisions the dashboard must support.

  2. 02

    Architecture

    Connections, data model, security and refresh.

  3. 03

    Prototype

    KPIs, navigation and identity approved before the final build.

  4. 04

    Delivery

    Development, testing, acceptance and training.

  5. 05

    Evolution

    Support, maintenance and new analyses as the business changes.

Your data protectedCredentials never exposed, least-privilege access and full separation between clients. How we do it →
No blind deadlinesTimeline and price only after seeing a real sample of the data.
Everything documentedCalculation rules, sources and refresh routines delivered in writing.
Frequently asked questions

Before you start.

Didn’t find your question? Write to contact@omnids.net.

Power BI or web dashboard: which one should I choose?

Power BI is ideal when the company already uses the Microsoft ecosystem and wants autonomy to explore the data. A web dashboard is best for sharing with many people without per-user licenses, embedding in a portal or having full control of the design. We recommend the best path during the assessment.

My data is in spreadsheets. Is that a problem?

No. Many projects start in Excel. We structure the spreadsheets, create cleansing rules and, when it makes sense, suggest a gradual migration to a database.

How much does a dashboard cost?

The Essential Dashboard starts at R$ 1,900 and the Professional at R$ 3,900, as fixed-price projects. Monthly maintenance starts at R$ 390. The final price depends on the sources, data volume and number of pages, and you receive a written proposal before any commitment.

How do hiring and payment work?

I work as an independent professional under the OmniData Solutions brand. Every project has a written proposal and service agreement. Payment is made against a receipt; when the client is a company, with an RPA (Brazil’s self-employed payment receipt) and the withholdings required by law.

How long does a project take?

An Essential Dashboard has a target of 7 to 10 business days after data approval. Larger projects are planned in stages. We only set a timeline after seeing a real sample of the sources.

How do security and confidentiality work?

We work with least-privilege access, never expose credentials, keep each client isolated and can sign a non-disclosure agreement. In Power BI we apply row-level security (RLS) when needed. Details in Security and confidentiality.

What about after delivery?

You receive documentation and training. If you prefer, the Ongoing Plan covers refresh, monitoring, fixes and small monthly improvements.

Do you work with companies in other cities or countries?

Yes. All work can be done remotely, with online meetings, for companies anywhere in Brazil — and abroad.

Request an assessment

Shall we turn your data into better decisions?

Tell us a little about your company, your data sources and the challenge you want to solve. We will get back to you with an initial assessment and next steps.

  • Free initial call
  • Assessment with next steps
  • No commitment
contact@omnids.net
Rather talk first? Pick a time for a 30-minute call, no commitment. Book a call