
 Open dashboard
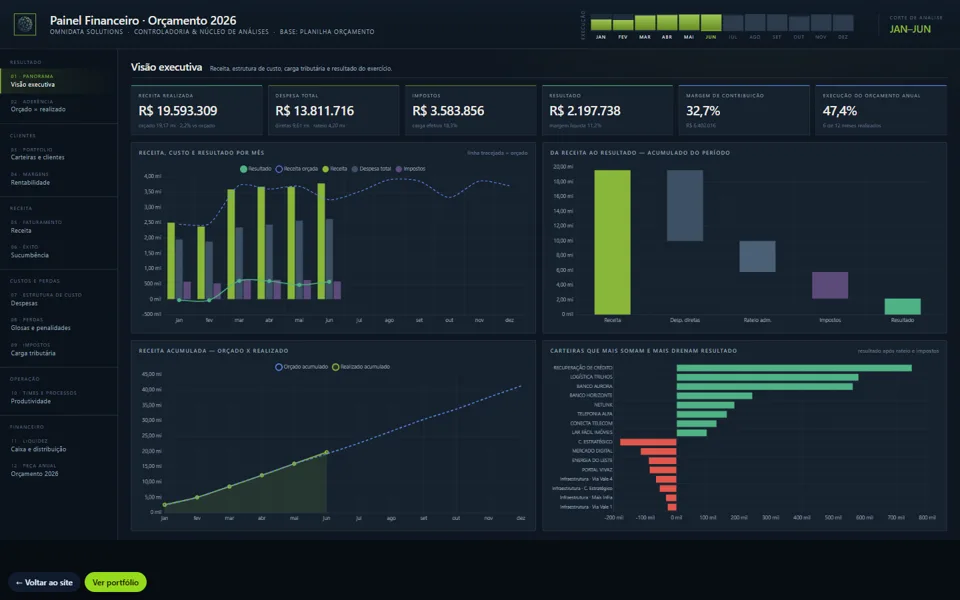
Financial Dashboard
Budget vs. actuals by portfolio, cost structure, tax burden, cash and the annual budget.
- Revenue vs. budget
- Margin
- Taxes
- Cash
- 12 pages
Complete dashboards for finance, legal, settlements, portfolios and people, shown here with fictitious names, values and records. The Power BI reports were rebuilt in HTML with the same visuals and page navigation. Dashboards are in Portuguese.
Open dashboard
Budget vs. actuals by portfolio, cost structure, tax burden, cash and the annual budget.
 Open dashboard
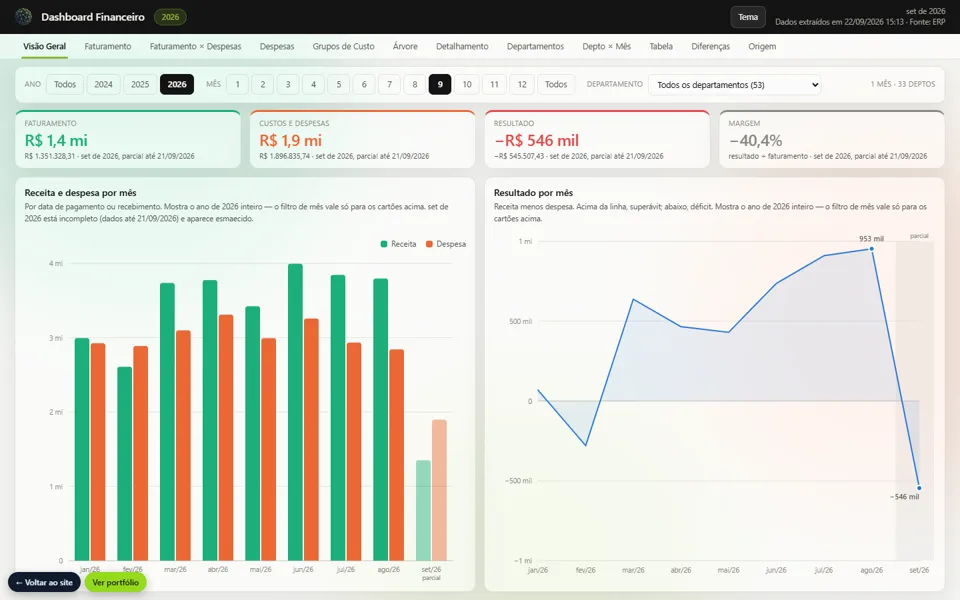
Billing, expenses by group and category, ERP reconciliation and month-by-month results.
 Open dashboard
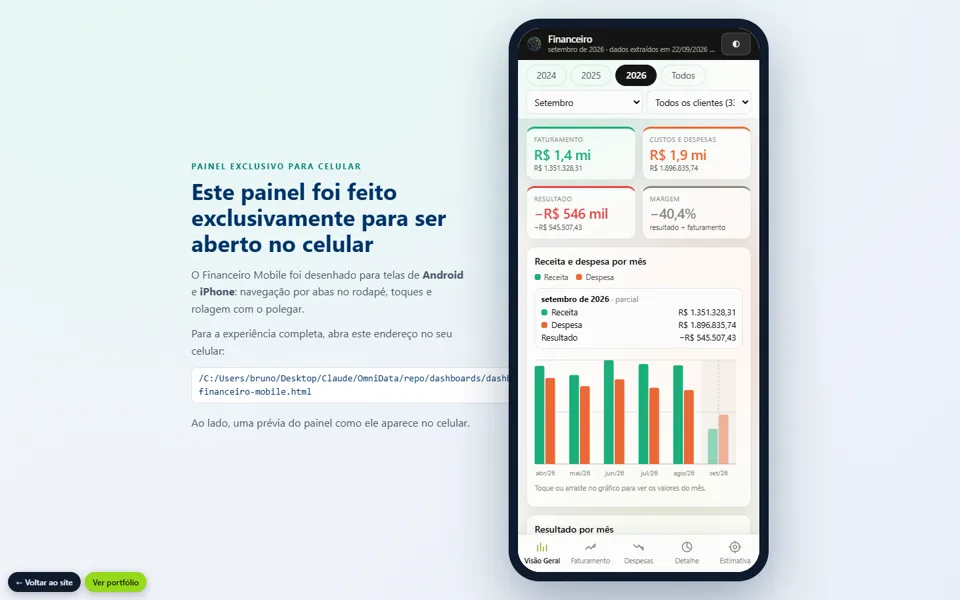
The same financial view designed for phones, with full-year projection and prior-year comparison.
 Open dashboard
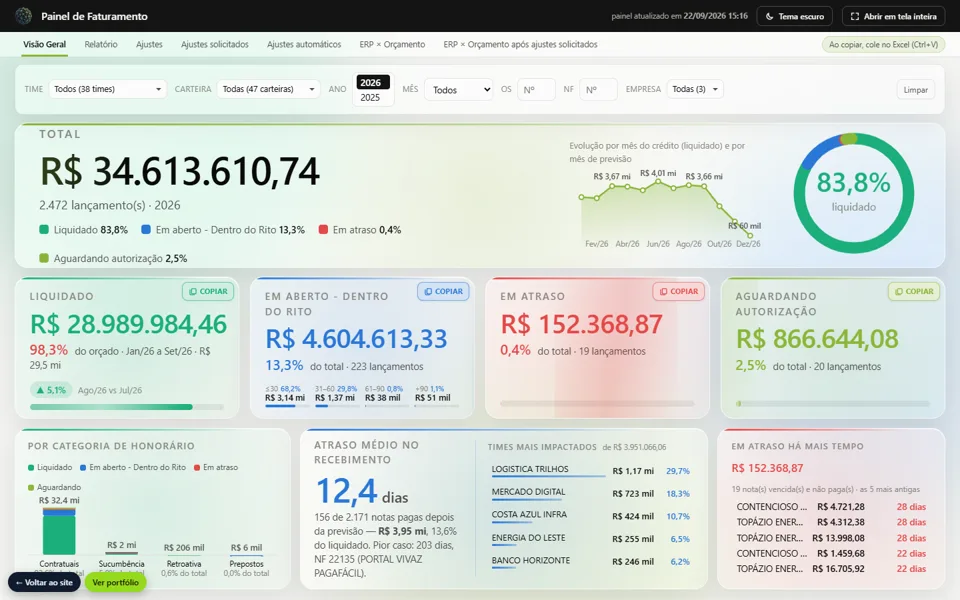
Invoices issued, paid, open and overdue by team and portfolio, checked against the budget.
 Open dashboard
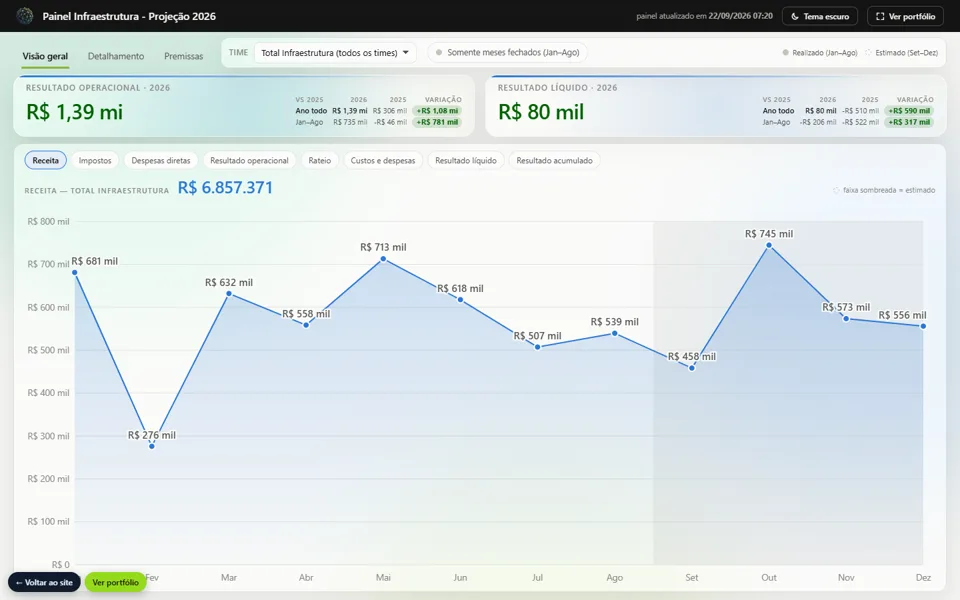
Operating and net results by contract, with full-year projection, half-years and prior-year comparison.
 Open dashboard
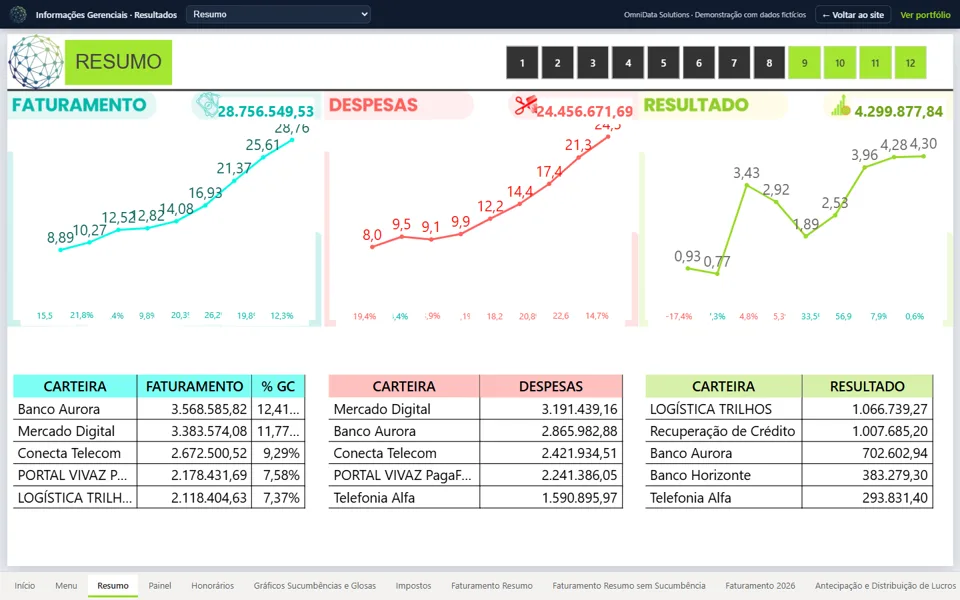
Monthly results presentation: billing, expenses, fees, write-offs and taxes.
 Open dashboard
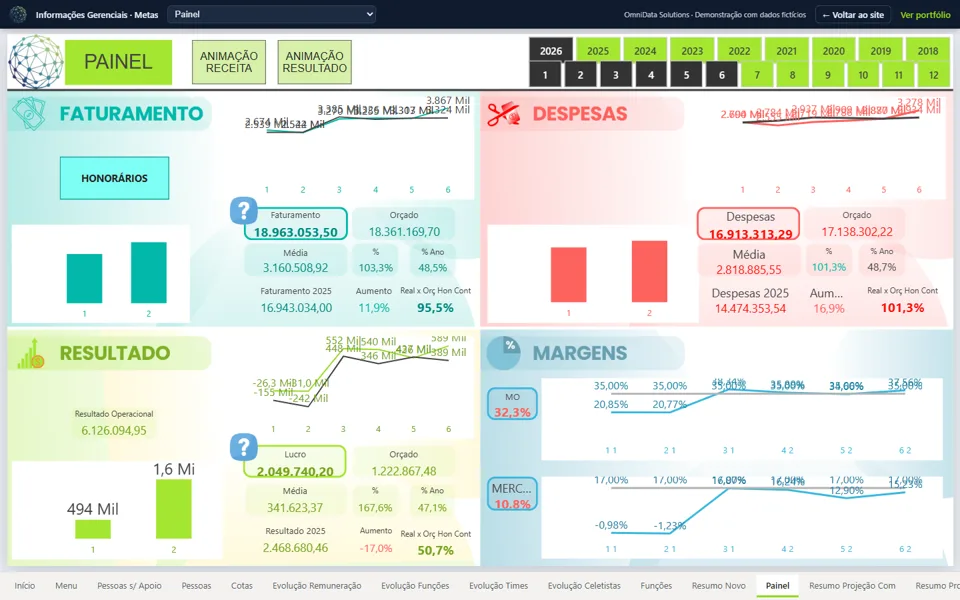
Target tracking by portfolio: results, profitability, direct expenses, backlog and productivity.
 Open dashboard
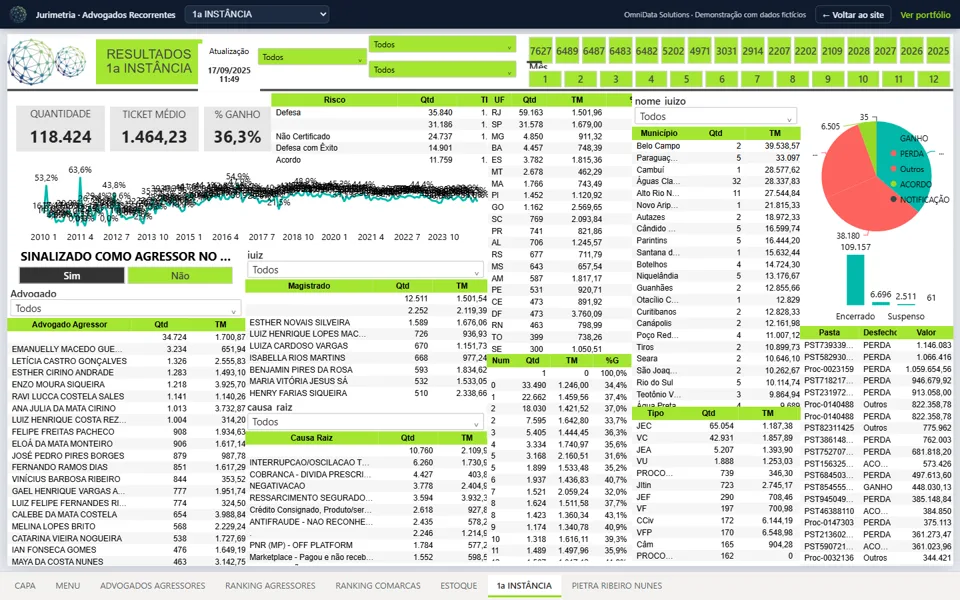
Rankings of repeat lawyers and plaintiffs, court districts, outcomes and average award.
 Open dashboard
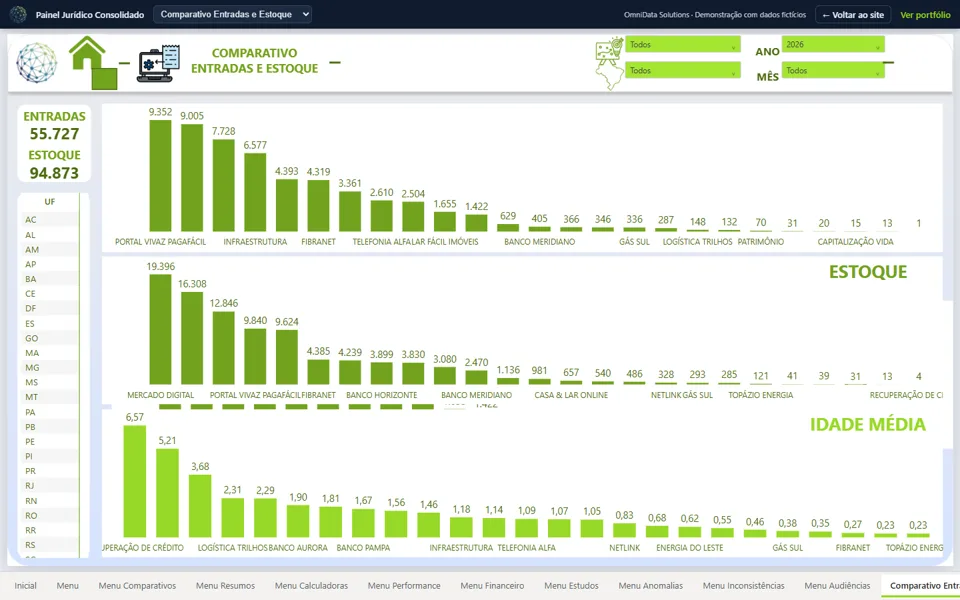
Intake vs. closings, backlog, hearings, anomalies by root cause, costs and commercial performance.
 Open dashboard
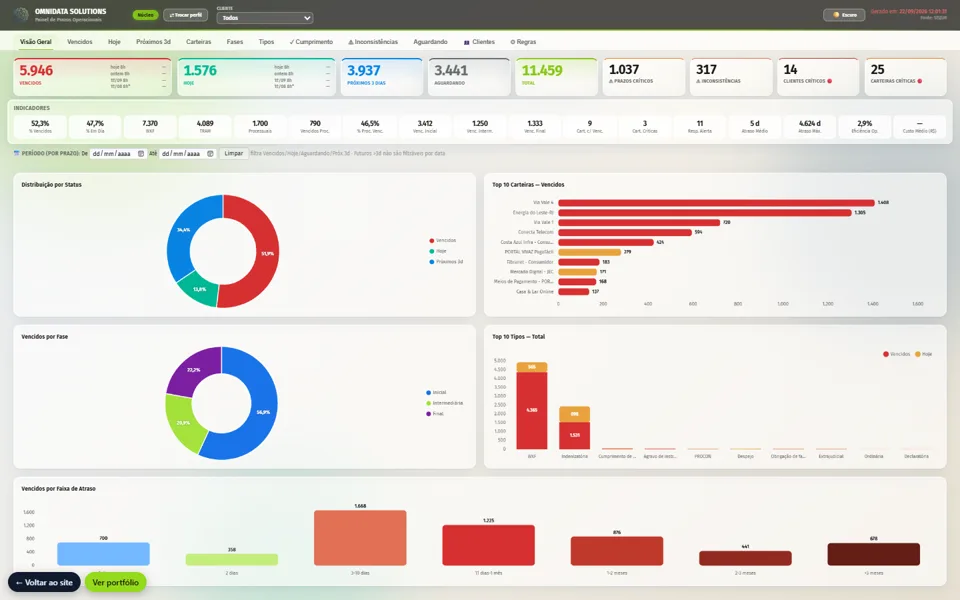
Overdue, due-today and upcoming deadlines by profile, with inconsistencies and compliance.
 Open dashboard
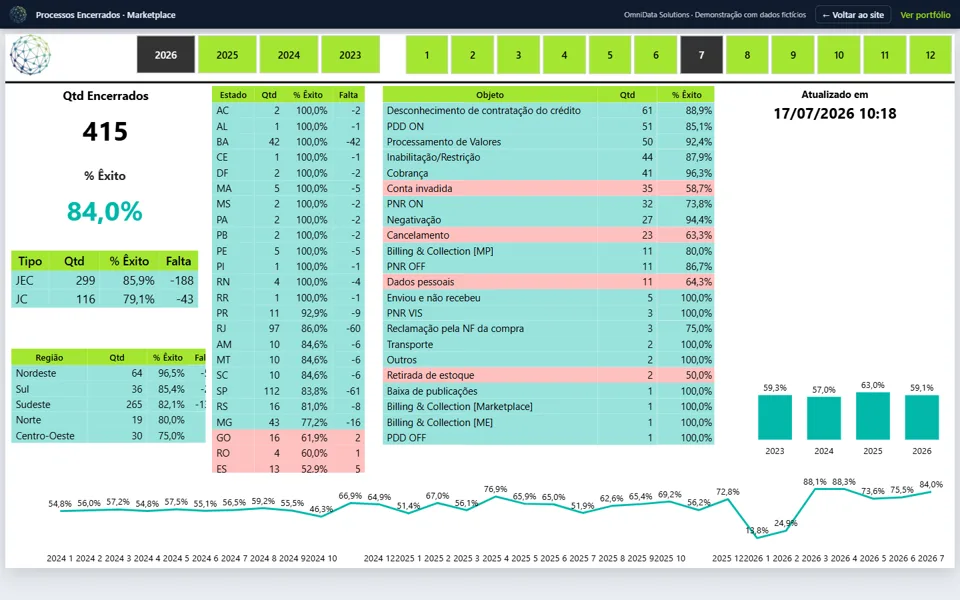
Closings by state, region, type and subject, with success rate and distance to target.
 Open dashboard
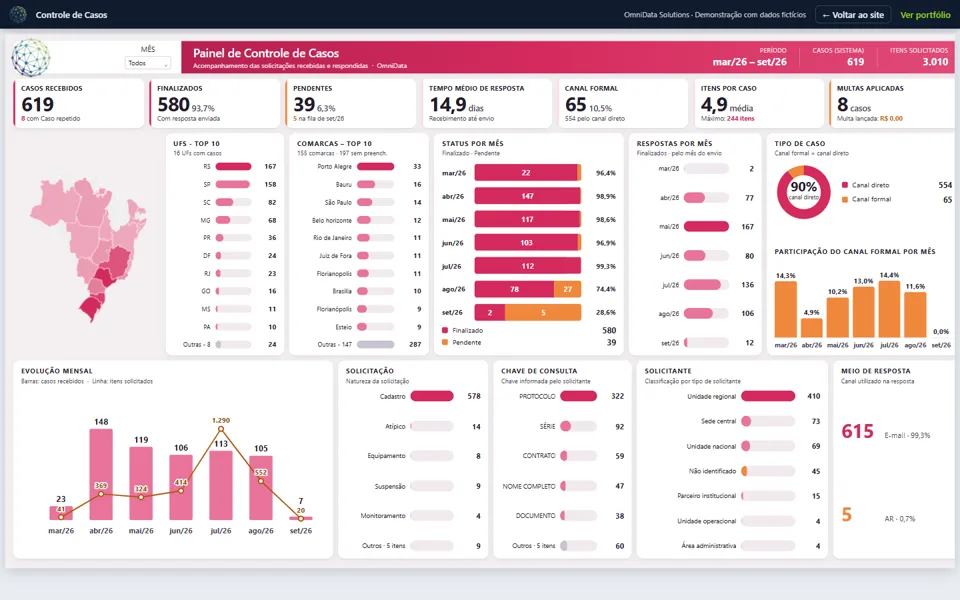
Cases received, completed and pending, response time, map by state and requester types.
 Open dashboard
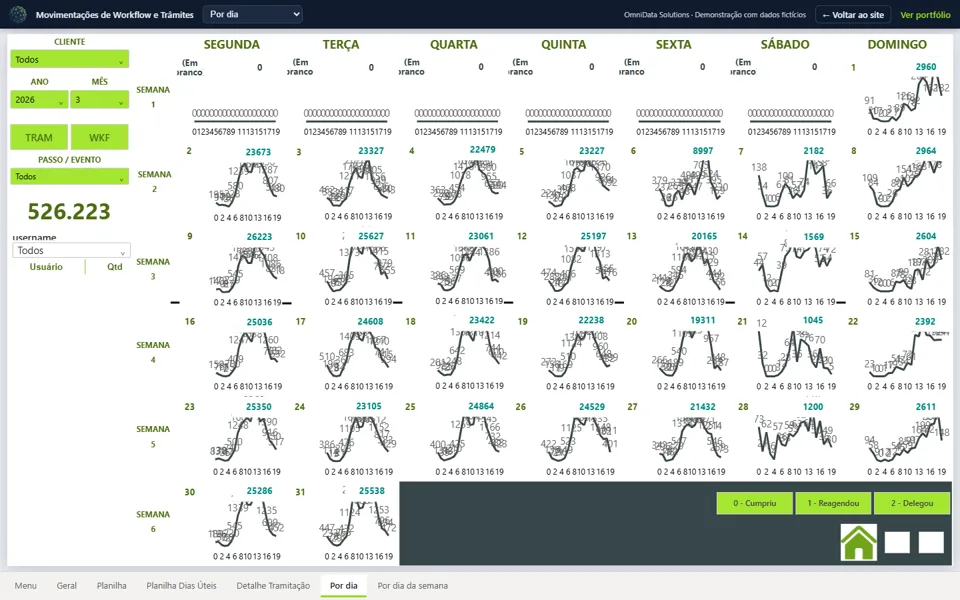
Tasks and case steps: intake, completions, productivity by owner and idle folders.
 Open dashboard
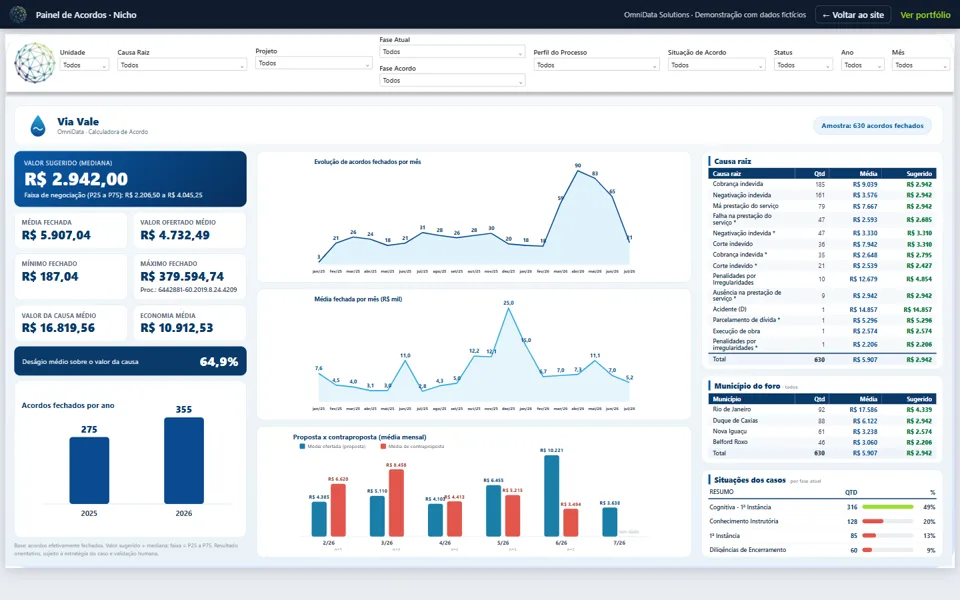
Offers, counteroffers, closed settlements, savings and discount by root cause and case stage.
 Open dashboard
Suggested settlement value by median, negotiation range, average by root cause and by city.
 Open dashboard
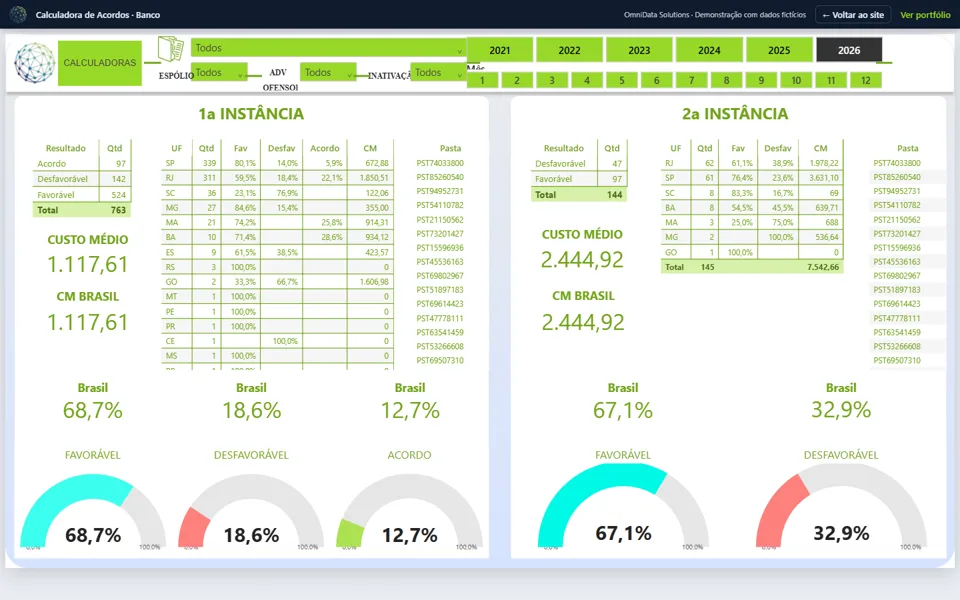
First- and second-instance outcomes by state, average cost and favorable, unfavorable and settlement rates.
 Open dashboard
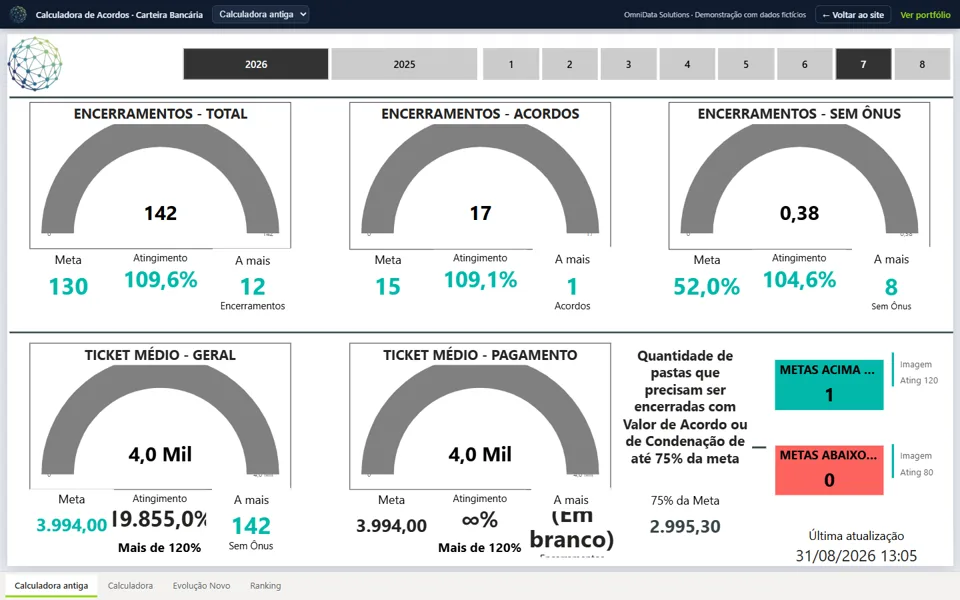
Settlement simulation with success indicators, average award and gauges by scenario.
 Open dashboard
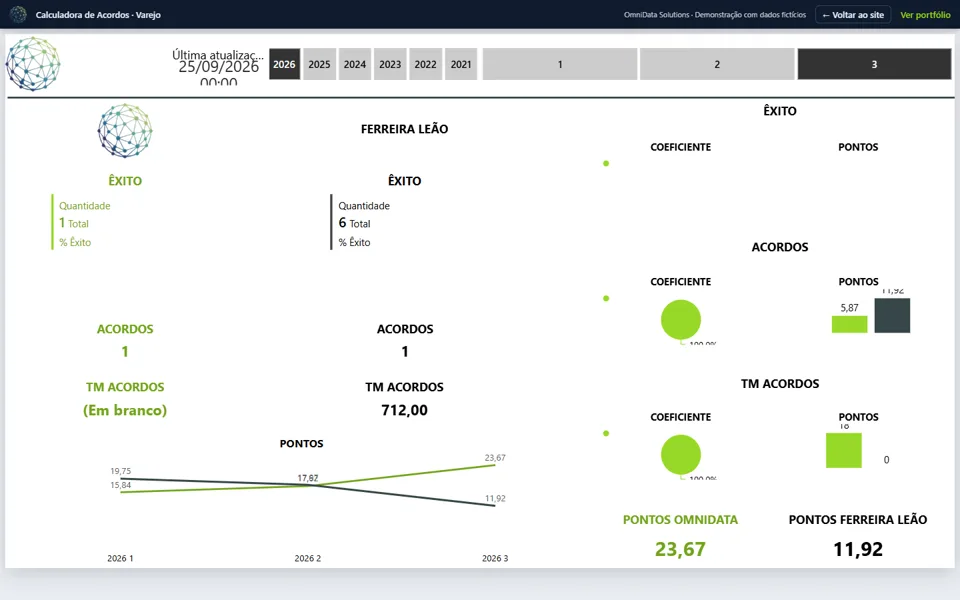
Settlement, dismissal and average-ticket coefficients to support the settlement decision.
 Open dashboard
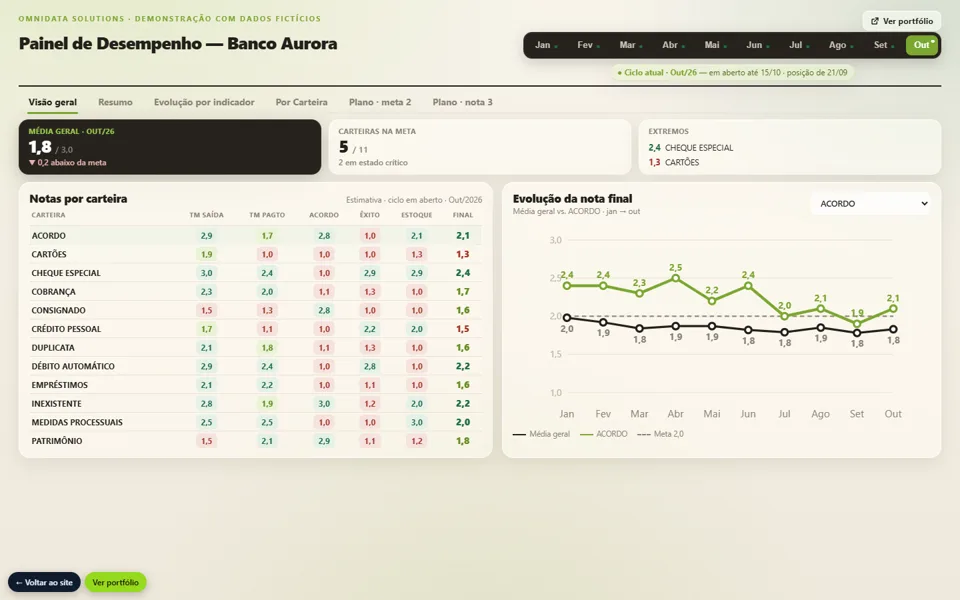
Weighted score per cycle (closing, payment, settlement, success, backlog) and gaps to target.
 Open dashboard
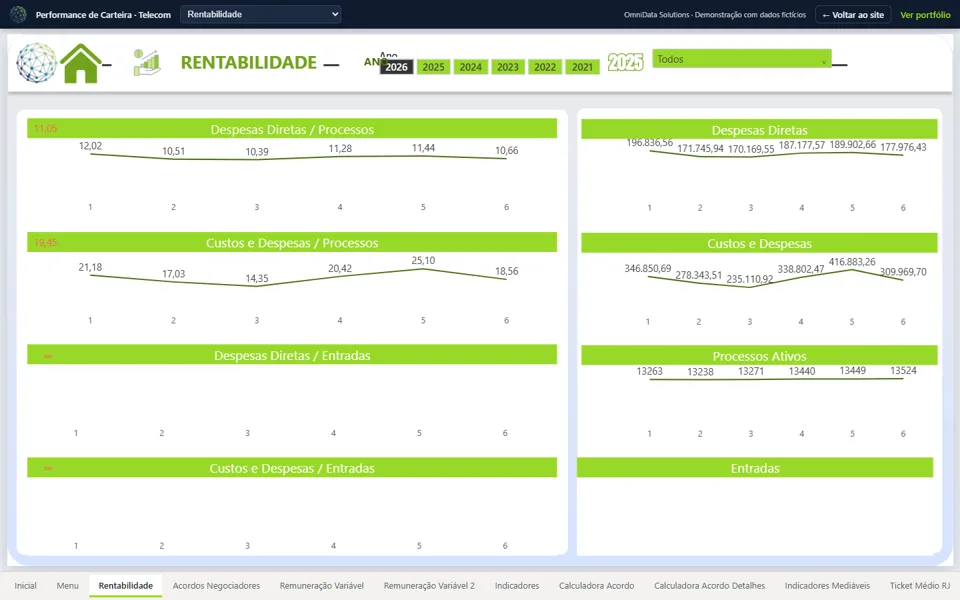
Profitability, settlements by negotiator, variable pay, mediable indicators and average ticket.
 Open dashboard
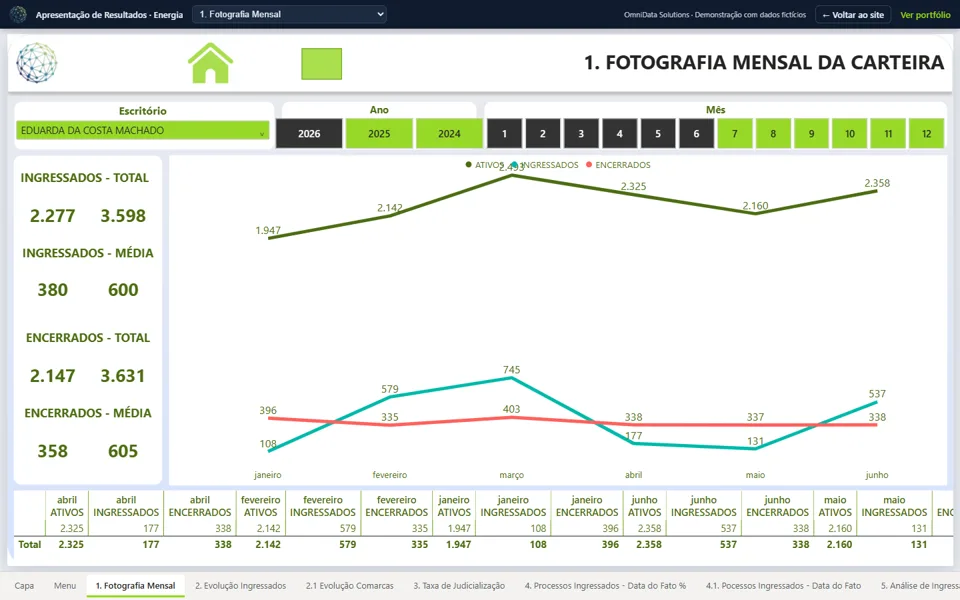
Monthly portfolio snapshot, intake vs. closings, districts, litigation rate and outcomes.
 Open dashboard
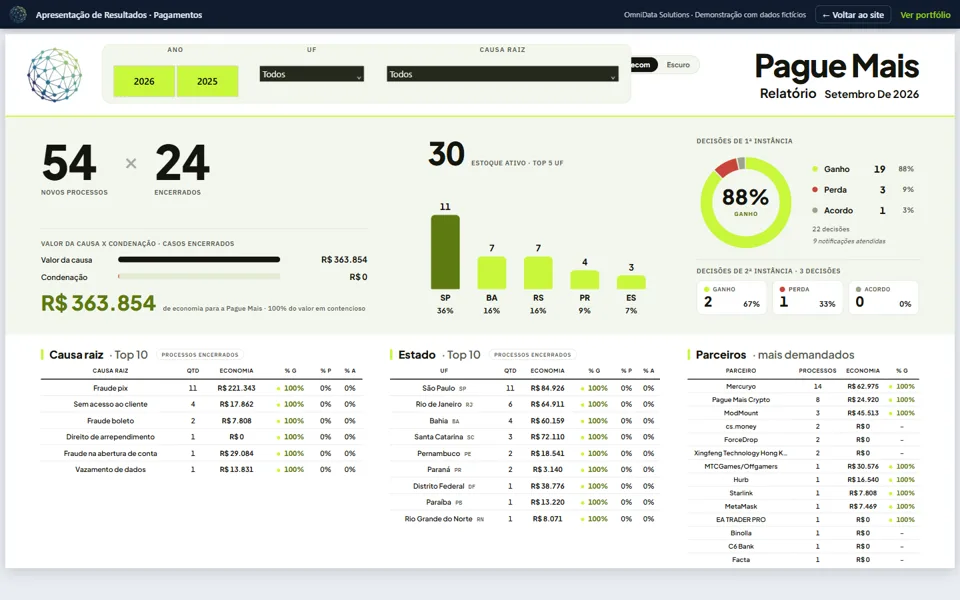
Portfolio results by case type, savings generated and success rate, in presentation format.
 Open dashboard
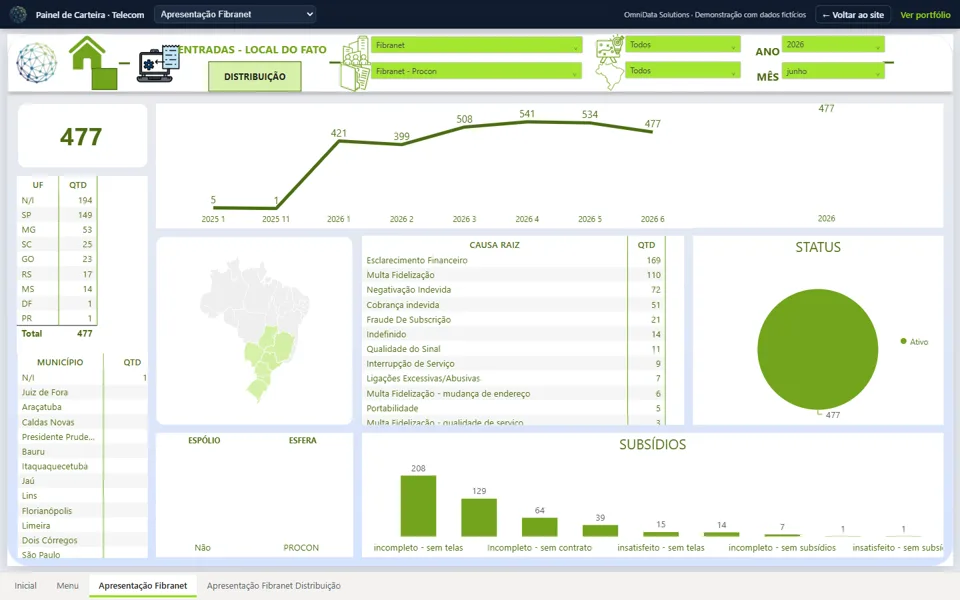
Active portfolio by state and city, root cause, status and supporting documents, with a map of Brazil.
 Open dashboard
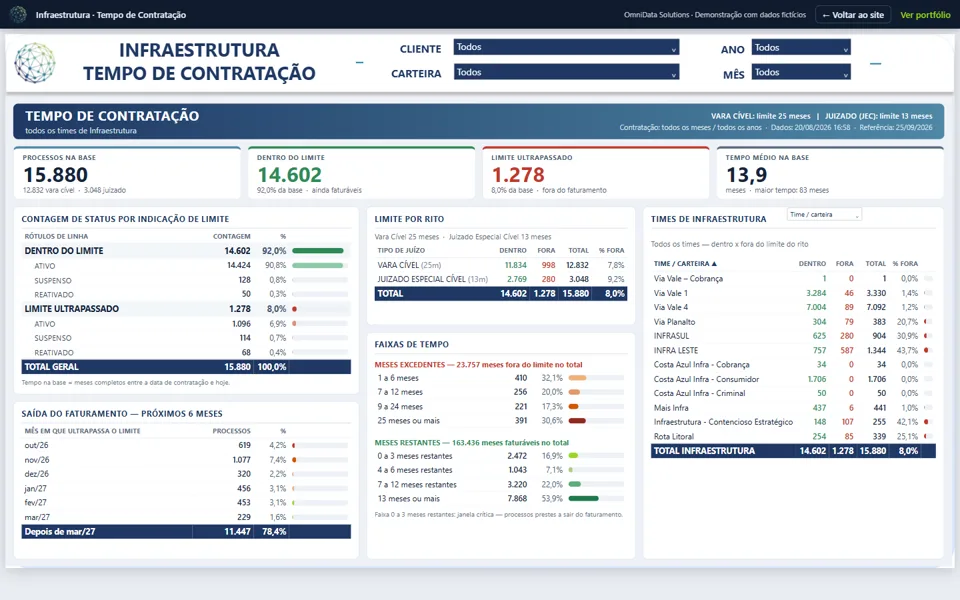
Time from case intake to hiring, by contract and period.
 Open dashboard
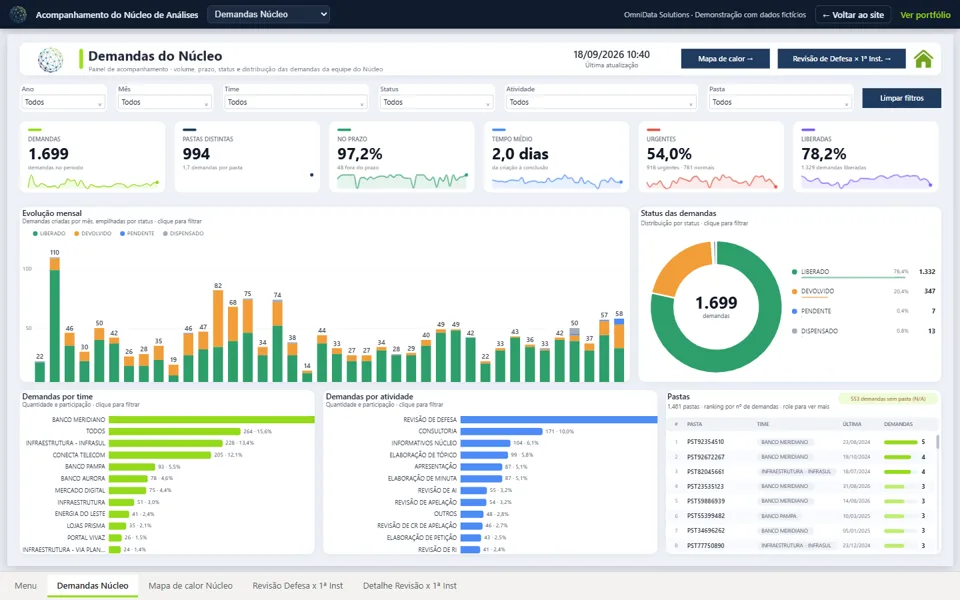
Analysis team output: heat map, defense reviews and detail by analyst.
 Open dashboard
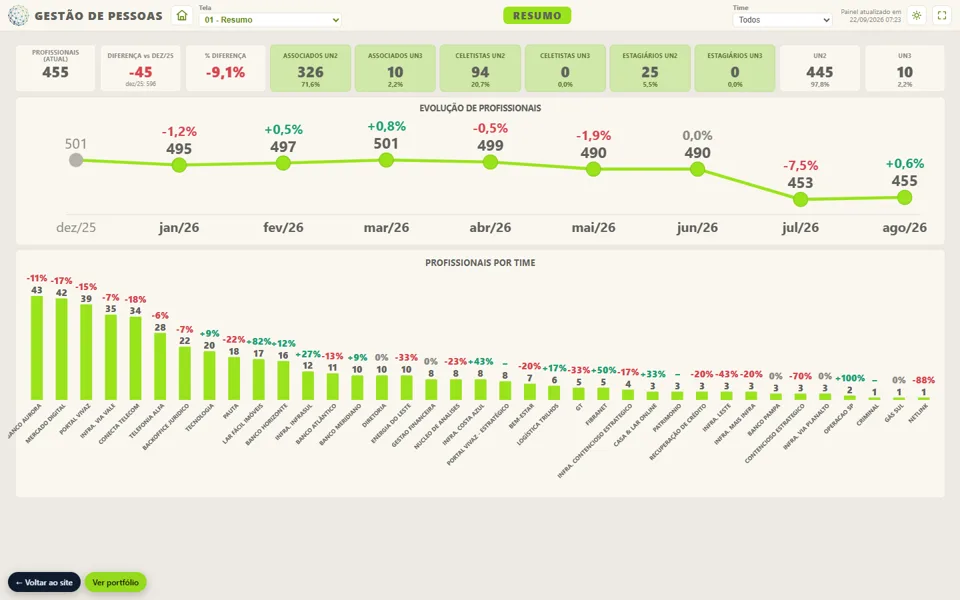
Headcount, hires and exits, turnover, diversity, careers, benefits and retention by team.
Want a dashboard like this with your data? Request a free assessment.